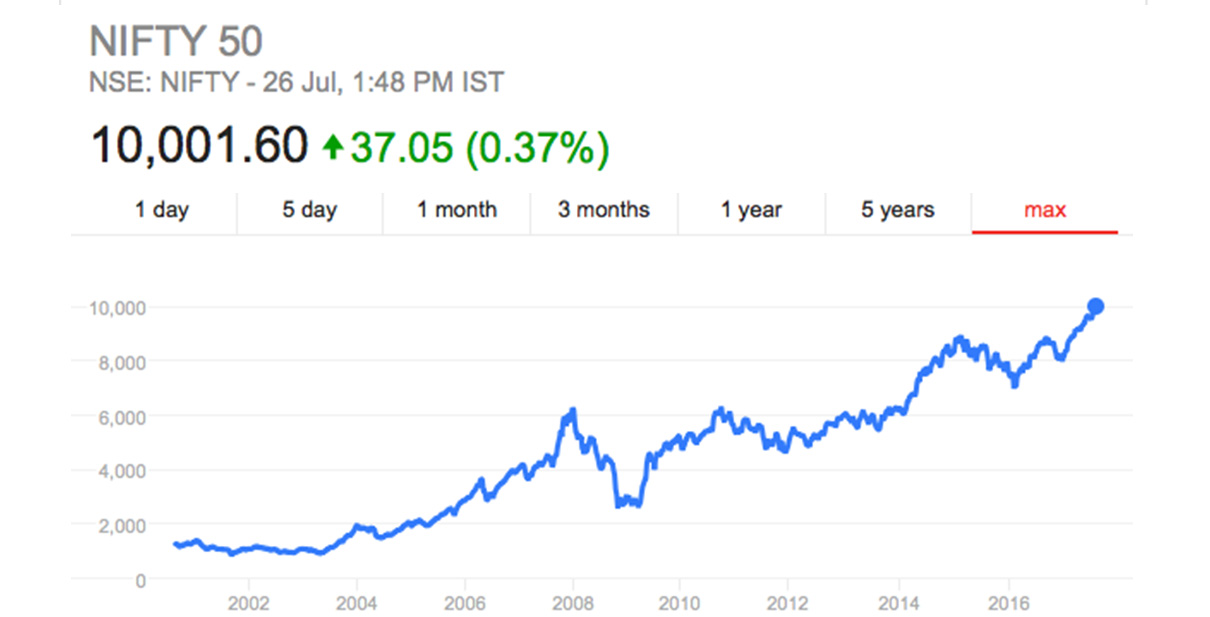
On 8th of Nov. 2016, When Govt. Of India took a strong step to demonetize 500 & 1000 rupee currency notes, Nifty 50 which is one of the most important indices of National Stock Exchange and looked as a benchmark index to see markets of our country was trading at 8500. It was like an earthquake situation in the economy and from next day all media channels & everybody started predicting what will happen in markets. Almost everybody predicted that markets will fall sharply as economy will slow down because Indian economy is a cash economy and there will be heavy cash crises for next few months which will affect consumption badly and in turn markets will fall sharply. Initially markets crashed by around 5 to 6% but later on it started rising surprisingly with sharp speed and crossed 10K at the end of July-2017. So almost in the period of last six months Nifty 50 has gone up from 8k to 10k which is around 25%. Now the question arises that why markets went up by 25%? What will happen now from here? Whether it will go up or down? While reading the title of the article you must have thought that I have the answer of these questions but let me tell you that I don’t have answers for all these questions but yes I can definitely analyze the current situation and tell you what strategy you should adopt.
Overvalued Markets: Current rally of Nifty from 8k to 10K has made markets extremely overvalued and risky. Markets have gone up only based on future expectations. But to understand this let us first understand EPS (Earnings per Share) & P E Ratio (Price to Earnings Ratio).
Earnings Per Share (EPS): First understand this by a simple example. For instance, there is a company which has issued 100 shares and has earned net profit of Rs. 1000. In this case Earning per share would be Rs. 10 (Earning per share= Net Profit/no. of shares issued)
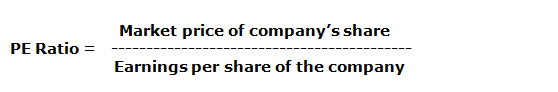
Price to Earnings Ratio: Price to Earnings Ratio is the ratio which reflects relationship between market price of the share and Earning per share of the company. It is arrived at through following formula.
Price to Earnings Ratio is an indicator of valuation of the company. It gives you an idea whether company is available at cheaper valuations or costly valuations. Let me explain with an illustration.
There are two companies Company A and company B. Both are in the same industry and following is the chart of their data.
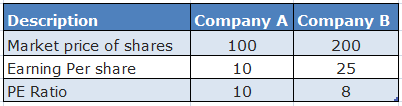
Looking at above table, at first instance it looks like company A is cheaper because its share is available at Rs. 100. And company B’s share is available at Rs. 200 so a layman investor would jump up and buy the Shares of company A considering that he is buying a cheaper company. But look at EPS, company B’s EPS is Rs. 25 whereas company A’s EPS is Rs. 10 only so PE Ratio of company B is 8 times and it is lower than company A which is 10 times. This indicates that your return on investment is 12.5% (25/200= 12.5%) for company B and for company A it is 10% (10/100= 10%) so if other factors are same which company’s share would you like to buy now? Company A which is expected to give you 10% return on your investment or company B which is expected to give you 12.5% return on your investment.
You can also look at PE Ratio like this, if you are buying company A with Rs. 10 EPS at Rs. 100 per share, this means you are paying price which is 10 years of profit of company A and if you are buying a company B with Rs. 25 EPS at Rs. 200 per share, you are paying price which is 8 years of profit of company B so which one you should buy now?
Lower the PE Ratio Better it is: From above discussion one point you should understand clearly is lower the PE Ratio better it is and so you should buy stocks when they are available at lower PE Ratio and you should look at PE Ratio for comparison between two companies of same industry and not the price on standalone basis.
PE Ratio of Nifty and important lessons:
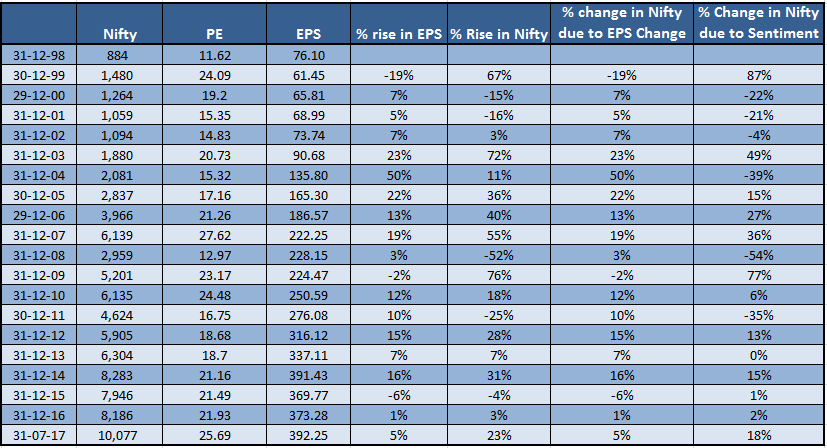
Now to understand current valuation of market let us see below table which gives some historical figures of Nifty 50, PE ratio and EPS to understand relationship between EPS and markets and analyze current situation.
Above table shows Nifty level at the end of every year from 1998 and at last I have taken recent level of Nifty on 31st July 2017. Logically there is direct relationship between markets and EPS (profits of the nifty companies) so Nifty should grow as much as EPS for Nifty companies taken together grows. But this is not true over short term because over short term participants(people who are trading ) in the market react to market events in more sentimental manner than logical manner so even though EPS has fallen markets may go up. To understand this you can see that in 1999 EPS has fallen by around 19% but still Nifty 50 has gone up by 67. Ideally Nifty 50 should have fallen but it has grown up so it shows that Nifty 50 has gone up due to sentiments by 87%. But when ever EPS has not grown and Nifty 50 has gone up than in next few years Nifty 50 has fallen even though earnings are positive, this can be seen in 2000, 2001 & 2002. In all three years EPS has grown positively but Nifty 50 has fallen because it had grown faster than EPS in 1999.
Similarly, in 2006 & 2007 EPS had grown by 13% & 19% but Nifty 50 had grown by 17% and 36% respectively so in next year 2008 it gave negative returns to the extent of 54%.
Lesson from the History: Above table shows that whenever market runs ahead of earnings growth it becomes overvalued and then either markets have to fall to match EPS or market may remain stable or range bound and EPS will grow to match market level. Similarly, if EPS is growing faster and markets are not growing than at some time in future markets will have to grow faster than EPS to match it.
Can we Predict Markets? : No, we cannot predict the markets, we can only understand whether markets are overvalued, undervalued or fairly valued. When the markets are undervalued investors can become aggressive and invest more in Equity, When markets are fairly valued investor’s should remain neutral and invest in equity as per their asset allocation requirement and when markets are overvalued investors can become conservative. In above table we can see that when EPS has grown faster, PE ratio has fallen and from there in next few years market has given good returns so lower the PE ratio better it is to invest in Equity. Let us see below Table.
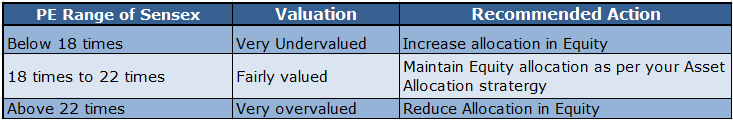
Every investor has his own Asset Allocation, suppose you have kept your asset allocation at 50% Equity and 50% Debt so that is your basic asset allocation. Now in case when markets are in undervalued zone (below 18 times PE ratio) you can think to increase your equity allocation from 50% to 60% or 70% and in times when markets are overvalued (above 22 times PE ration is ) you can slowly reduce your equity allocation from 50% to 40% or even less than that. In the times when markets are at fair value (between 18 to 22 times PE ratio) you should keep your equity allocation at 50%.Please remember that these levels of Equity allocation will differ for different investors based on their risk profile and asset allocation.
What to do in current situation where Nifty 50 is at 10000?
In current situation when Nifty 50 has crossed 10K we have to see what has happen to EPS growth. Post demonetization say form Dec-2016 to July 2017 EPS of Nifty 50 companies has grown by around 5% where as Nifty 50 has grown by around 25% (from 8000 to 10000) and this has made PE ratio to reach at 25.69 times level which is highly overvalued. Historically, whenever PE ratio has reached these levels equity market has not given good returns for next few months or years. In current situation we cannot predict on which side markets will move but one thing that I can surely say is markets are in highly overvalued zone so when markets are overvalued we should become conservative and should reduce our equity allocation. But this doesn’t mean that we should totally exit from equity. If as an investor you are keeping your equity allocation at 50% equity now you should reduce it to 40% to 30%. So if markets fall sharply you will not be affected badly and will have liquidity to buy equity at cheaper prices.
For New Investors: For new investors, they should not make a mistake of waiting for correction to happen in the market. They should start investing through Systematic Transfer plan Mode. Suppose one has to invest Rs. 100 out of which 50 rupees will go in Equity then he can keep these 50 rupees in liquid funds and invest them slowly over next 12 to 18 months in equity so if markets fall sharply he is not affected badly and has some money in liquid to average out and if markets keep increasing he is not totally left out.